Free AI Infographic Tools
Create professional infographics in seconds. Pick a type, describe your topic, and let AI do the rest.
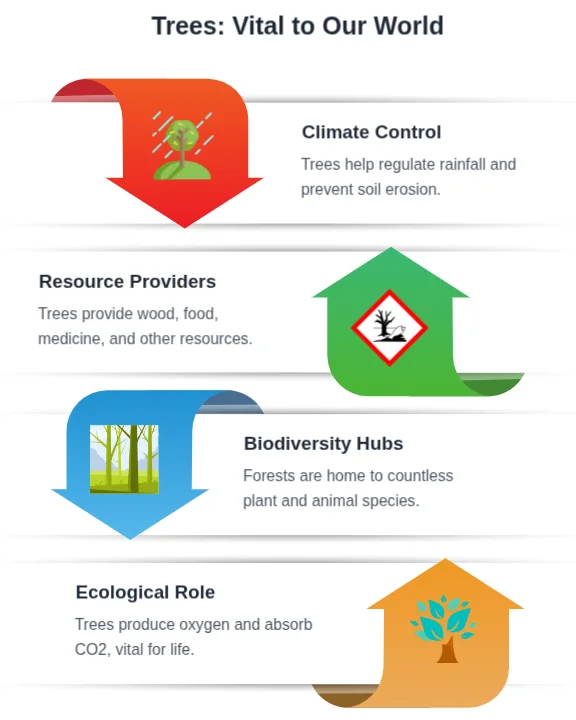
List Infographic Maker
Organize and present information in a clean, scannable format that readers can absorb at a glance.
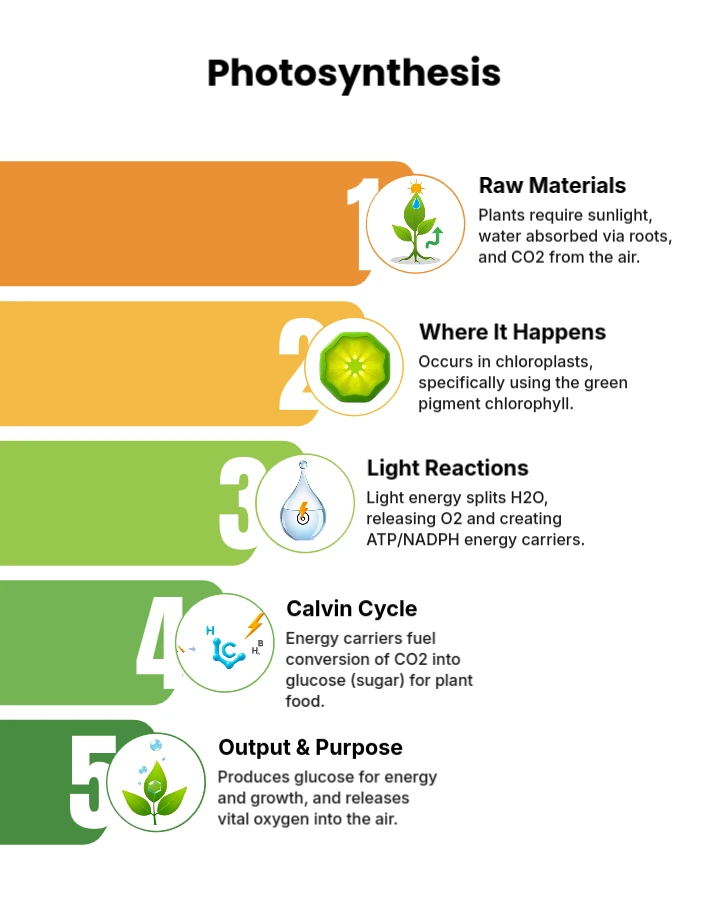
Process Infographic Maker
Visualize step-by-step workflows and procedures with clear, easy-to-follow designs.
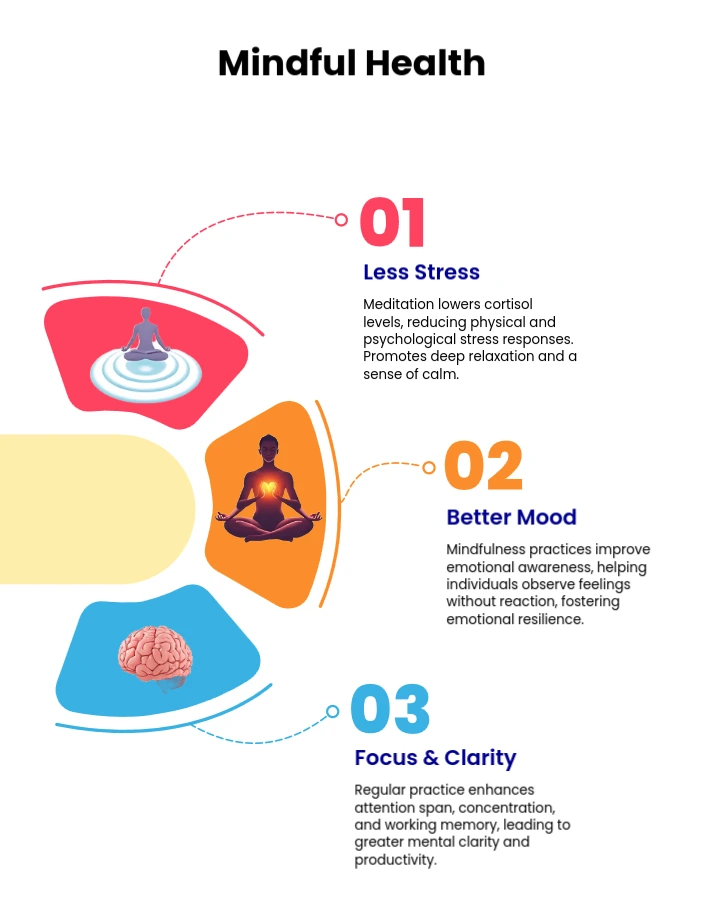
Hierarchy Infographic Maker
Illustrate organizational structures, rankings, and layered relationships with clarity.
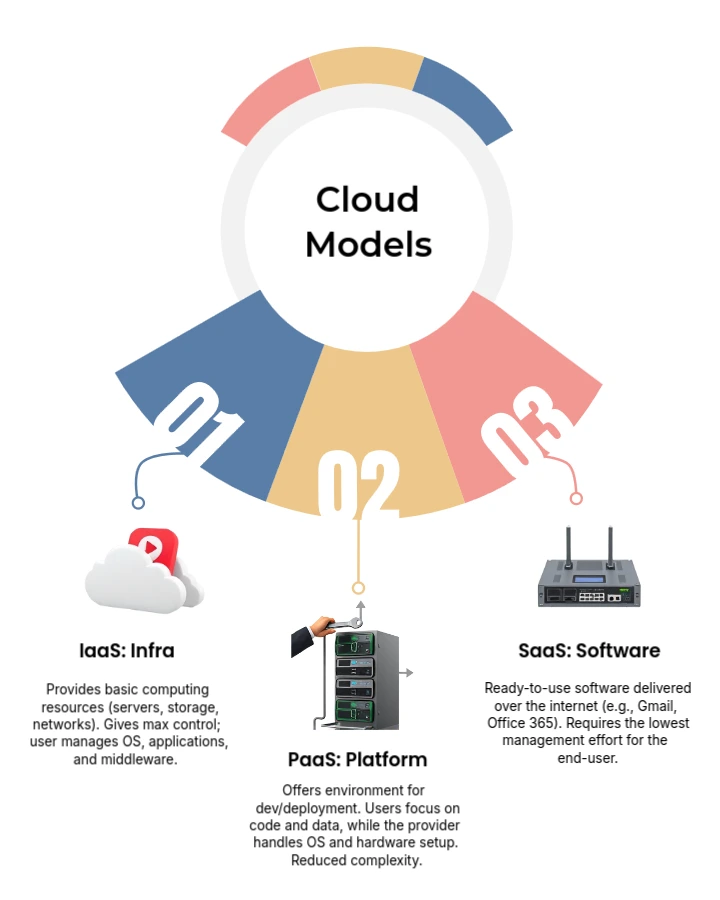
Cycle Infographic Maker
Depict recurring processes and circular workflows with engaging loop-based layouts.
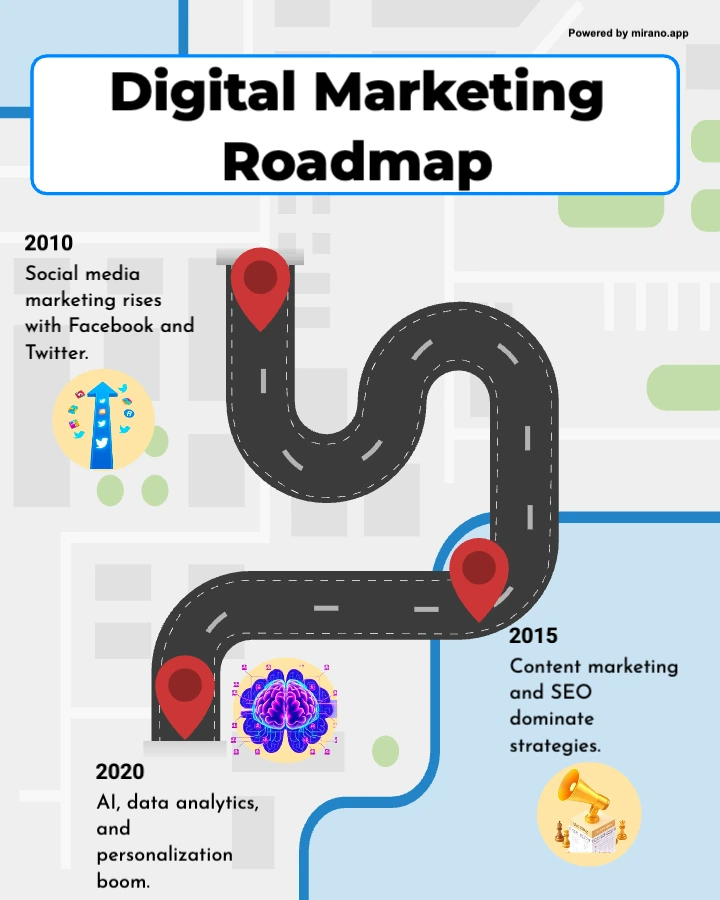
Timeline Infographic Maker
Map out chronological events, project milestones, and historical progressions visually.
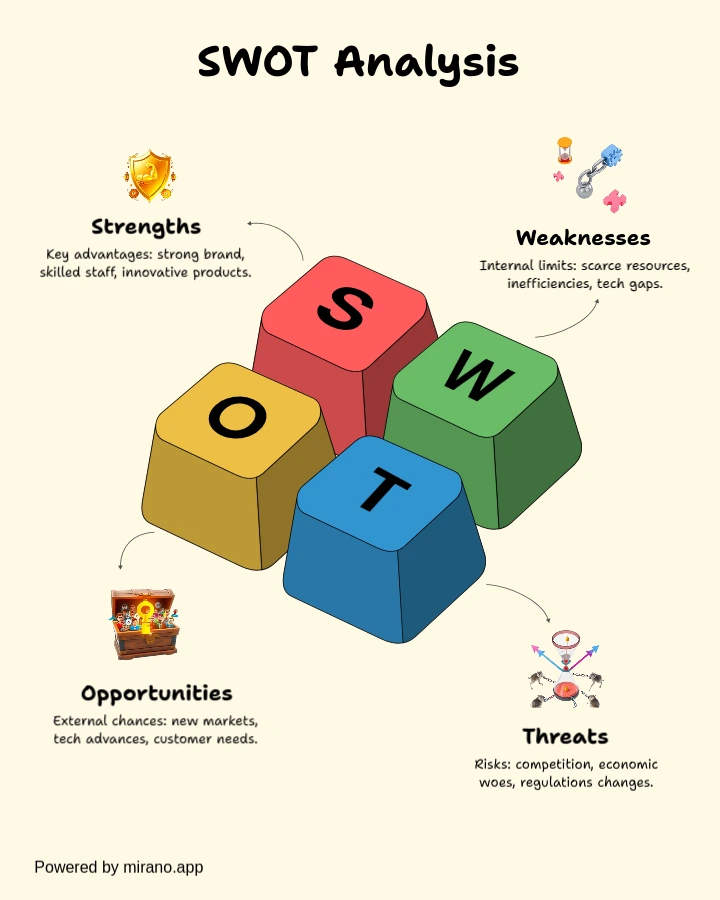
SWOT Infographic Maker
Build professional SWOT analysis visuals to evaluate strengths, weaknesses, opportunities, and threats.
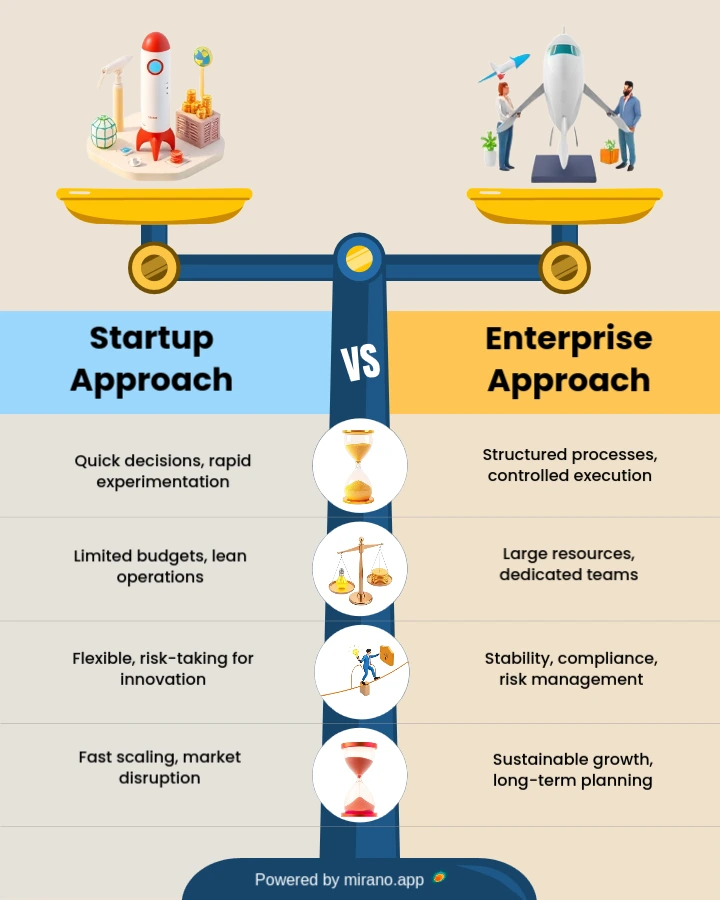
Comparison Infographic Maker
Place products, services, or concepts side by side with compelling visual contrast.
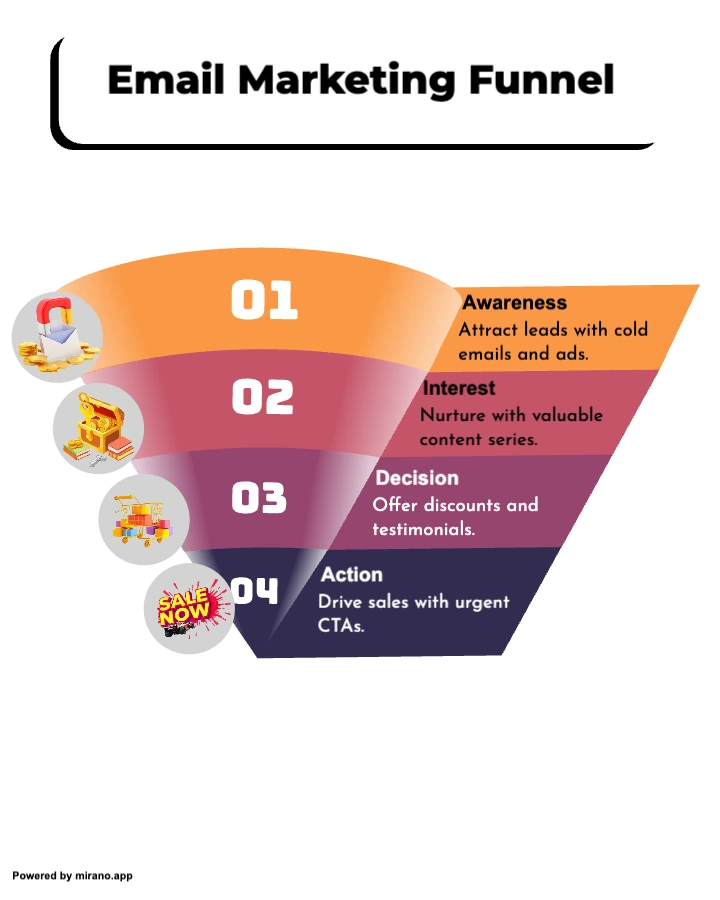
Funnel Infographic Maker
Visualize sales funnels, conversion stages, and filtering processes with layered graphics.
What is an infographic — and why does it work?
An infographic is a visual representation of information, data, or a process. Instead of presenting ideas as plain text, infographics combine layout, color, and typography to make complex topics immediately understandable. Research consistently shows that people process visuals 60,000 times faster than text — which is why infographics outperform plain copy across social media, presentations, and reports.
Different types of infographics serve different communication goals. A list infographic is best for top-10 roundups and ranked tips. A process infographic breaks down how something works step by step. A timeline shows how events unfolded over time. A SWOT infographic structures business analysis into four clear quadrants. Choosing the right type is the first step — and Mirano gives you all eight, free.
Mirano's AI generates the content and layout together. You describe your topic in plain language, and the AI selects the right structure, fills in the copy, and applies a professional design template — all in under 30 seconds. No design software, no blank canvas, no templates to wrestle with. Marketers, educators, content teams, and consultants use Mirano to produce on-brand visuals faster than any drag-and-drop tool can.