Visual Design & Infographics
Insights, tutorials, and best practices for creating compelling visual content that engages and informs.
Featured Article
Design Guide
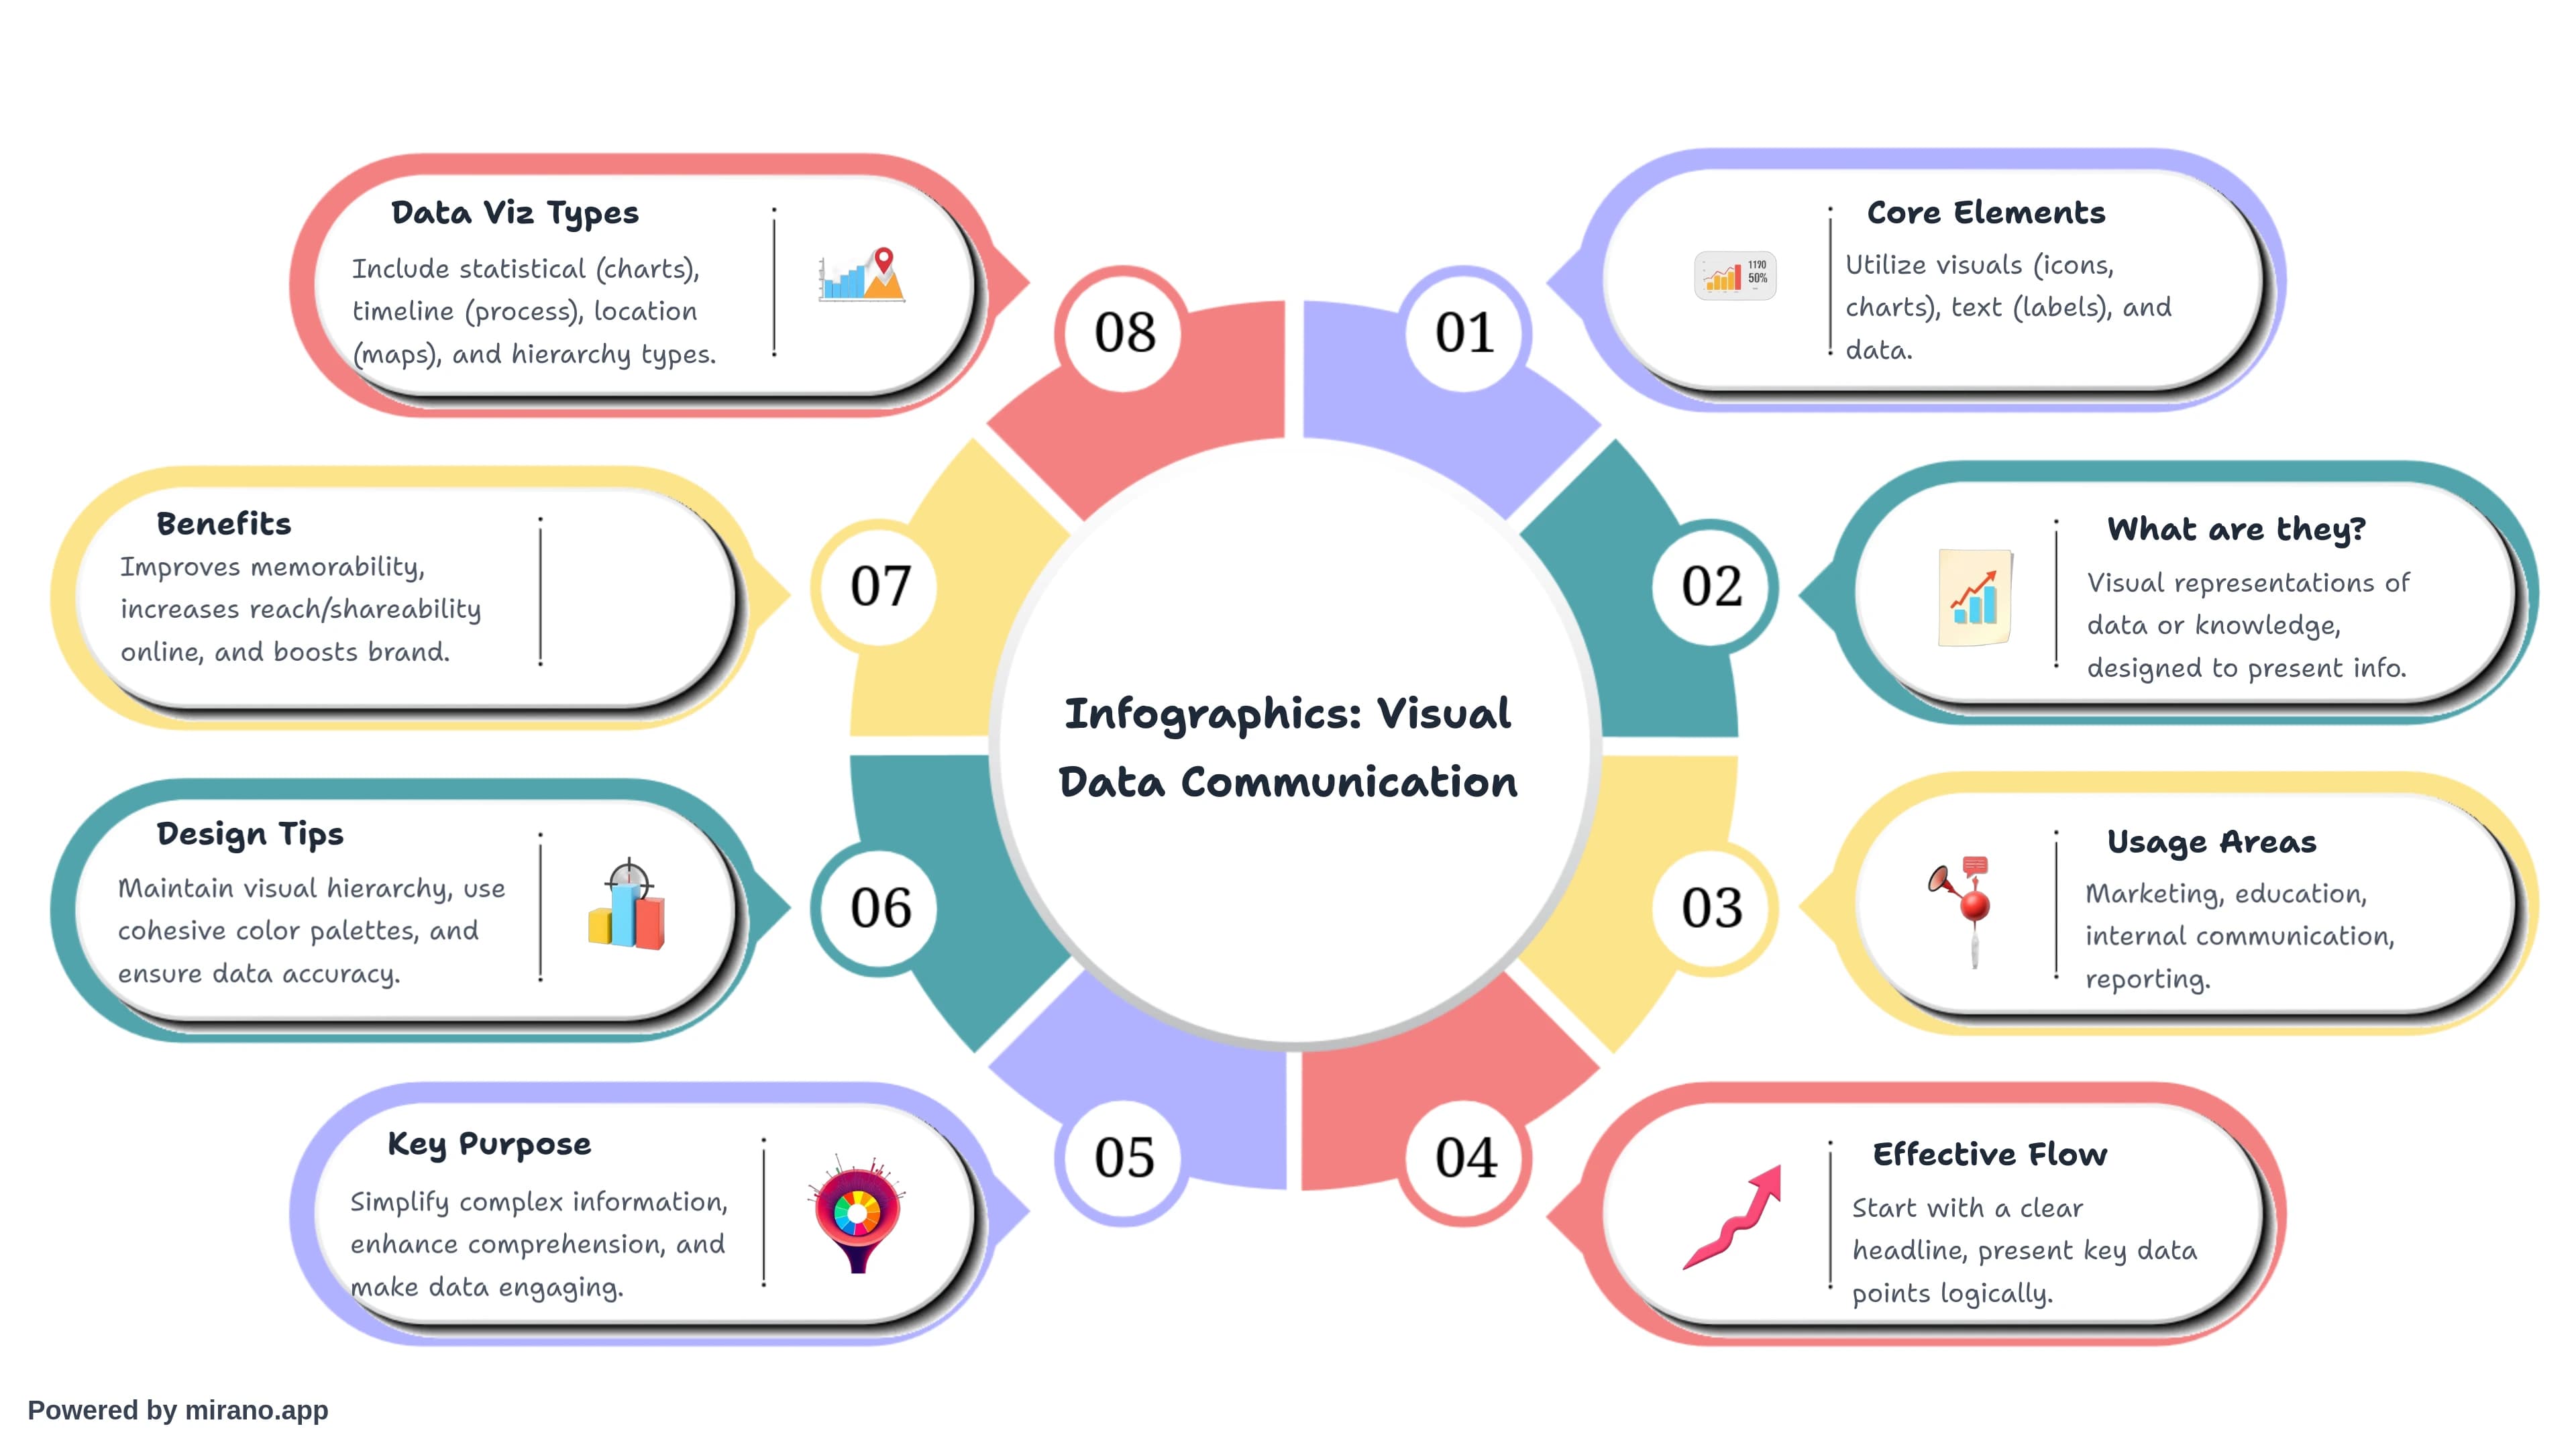
What is Infographics?
A comprehensive guide to understanding infographics, their impact, and how to use them effectively for visual storytelling.
•
8 min read
Read article
All Articles
Tutorial
Data Visualization Best Practices
Learn how to present complex data in clear, engaging ways that your audience will understand and remember.
•
6 min read
Design
The Science and Strategy of Color
Master the fundamentals of color theory and learn how to create harmonious, effective color palettes for your designs.
•
7 min read
Tutorial
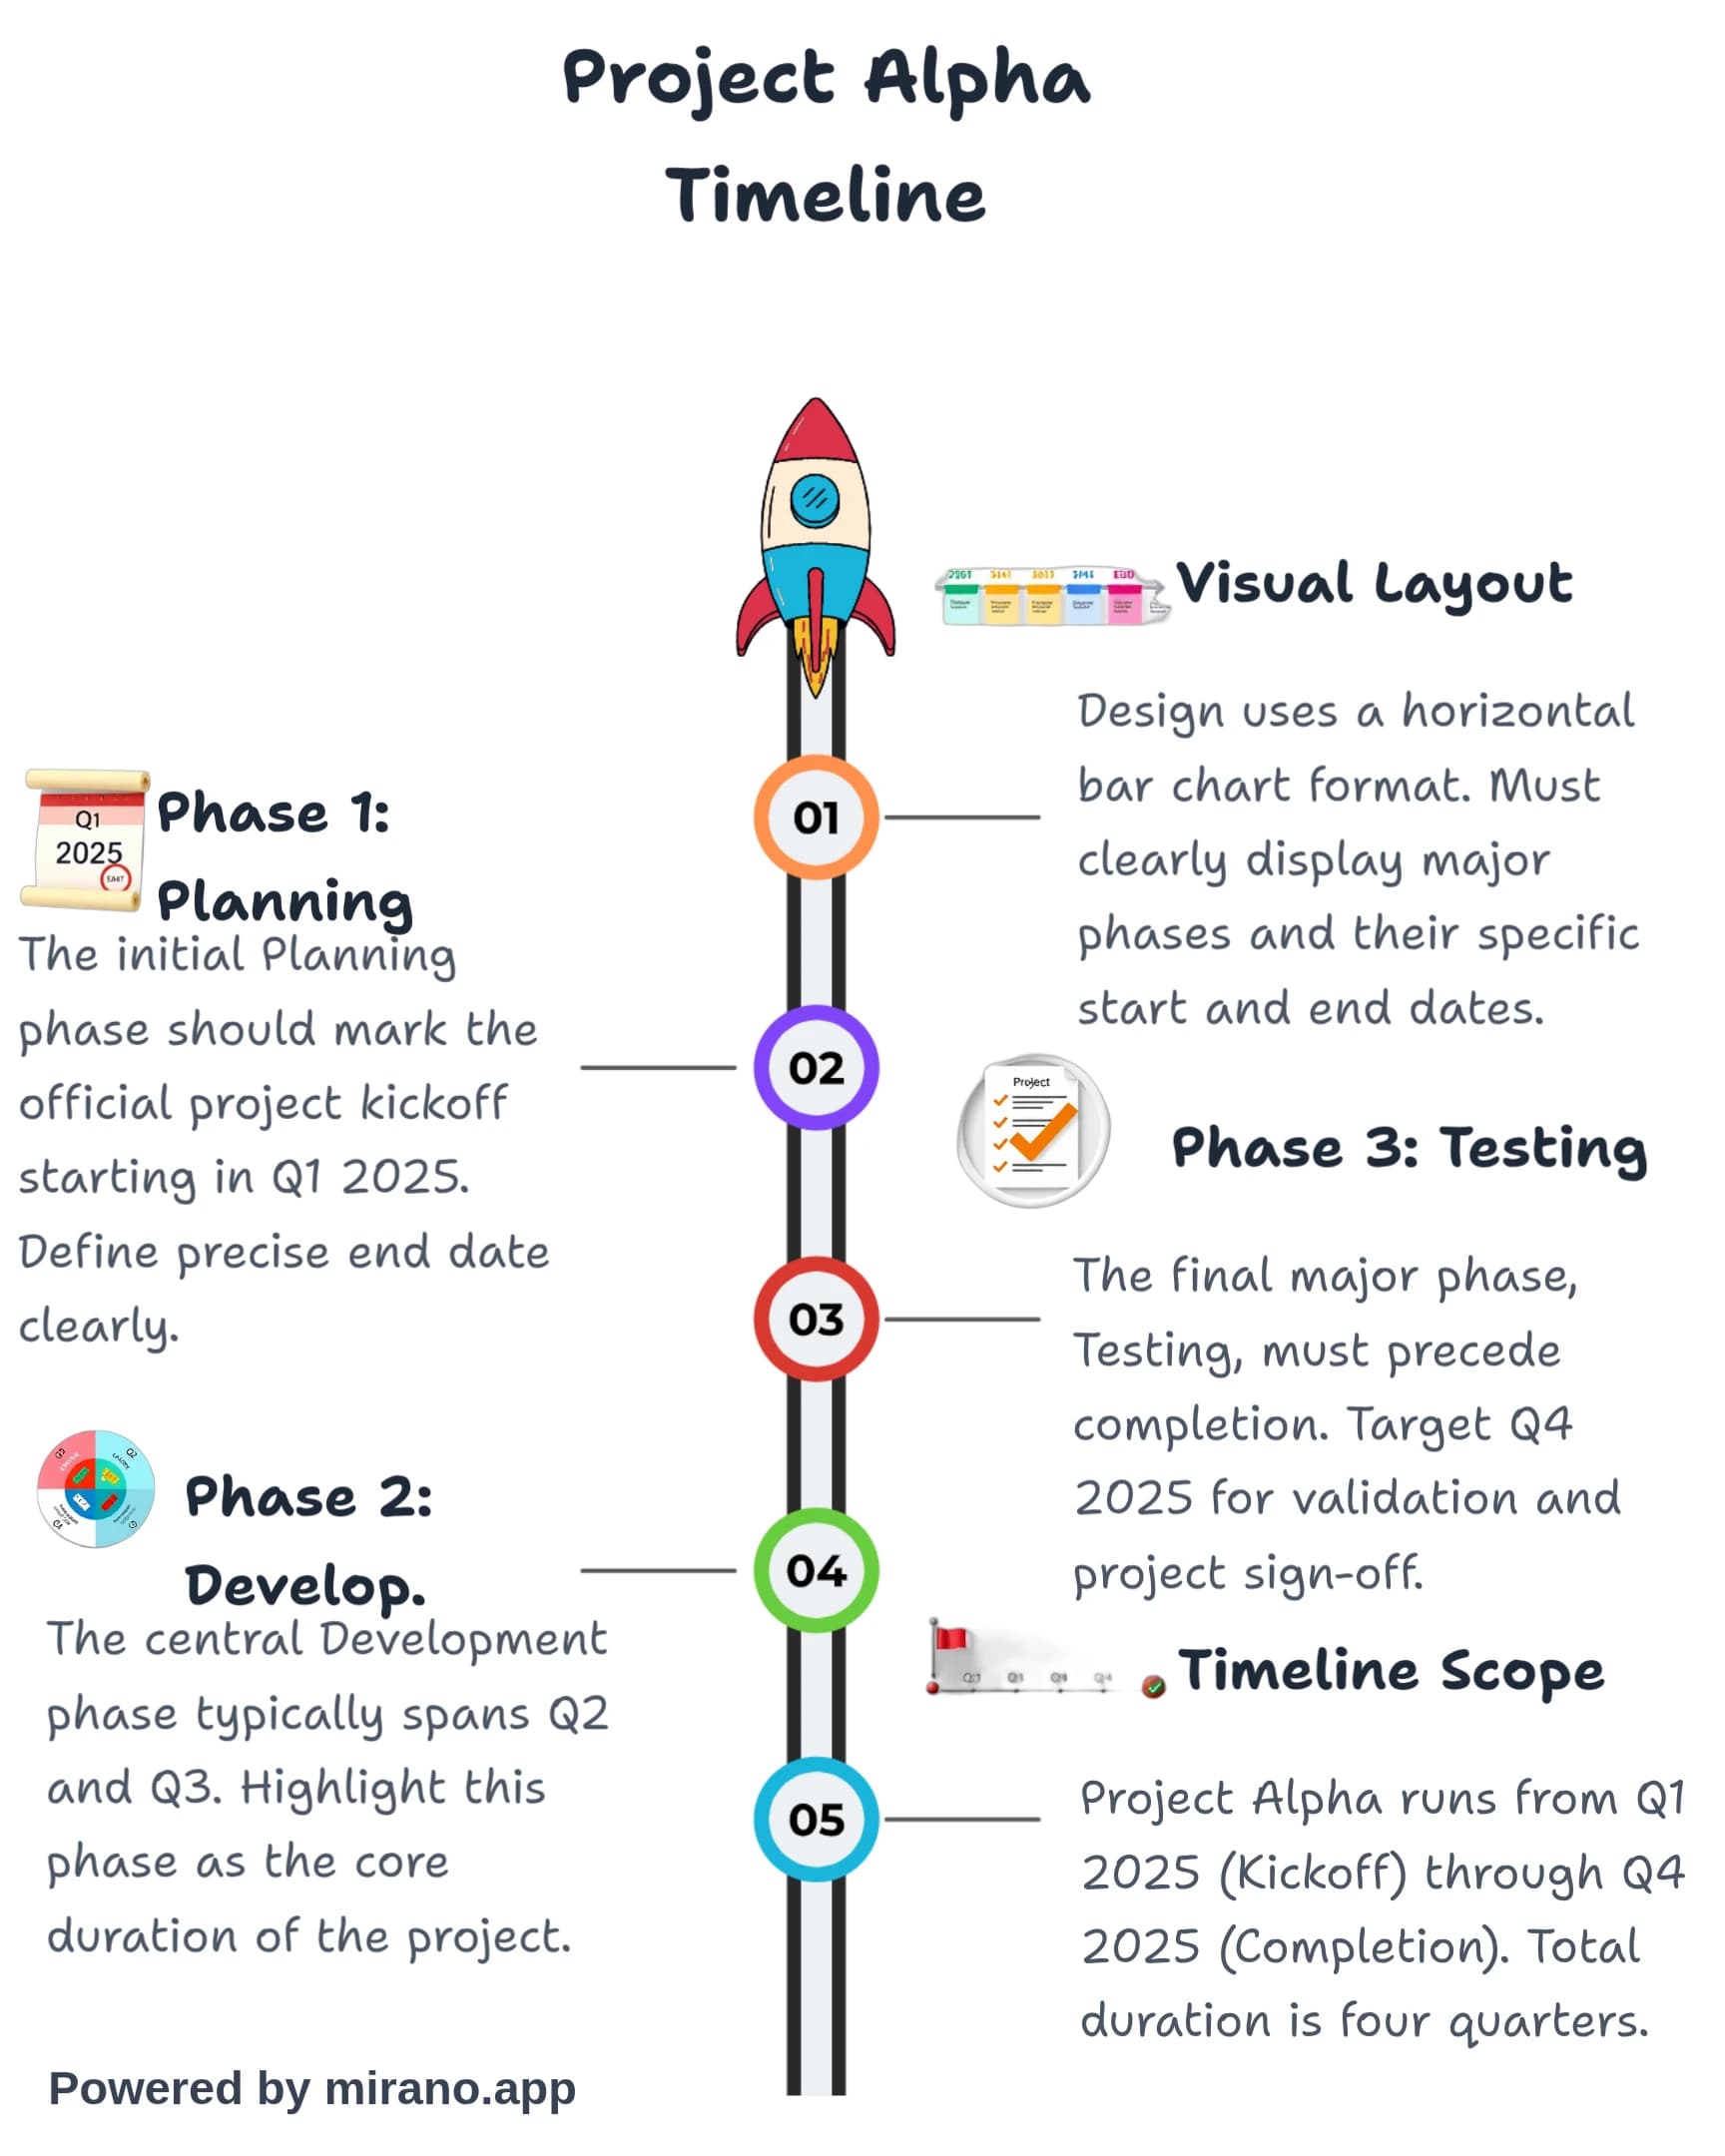
Creating Compelling Timeline Infographics
Step-by-step guide to designing timeline infographics that effectively communicate chronological information.
•
6 min read
Ready to Start Designing?
Transform your chronological data into compelling visual stories with Mirano.app. Access professional templates, intuitive design tools, and create stunning infographics in minutes.